Rows: 2,353
Columns: 5
$ region    <chr> "ACT - South West", "APY Lands", "Abbotsford", "Aberfoyle Pa…
$ lon       <dbl> 148.9773, 131.3201, 145.0000, 138.6094, 150.9138, 144.8245, …
$ lat       <dbl> -35.37625, -27.05758, -37.80368, -35.07996, -33.73492, -37.8…
$ region_id <int> 1, 2, 3, 4, 5, 6, 7, 8, 9, 10, 11, 14, 15, 16, 17, 18, 19, 2…
$ ws_id <chr> "949250-99999", "944740-99999", "959360-99999", "946830-9999…What this vignette covers
This vignette provides a quick tour of the ecotourism package’s tourism datasets. You’ll learn how to join quarterly counts with regional metadata, and optionally how to enrich the data by linking each region to its nearest weather station.
- Because of its size, the tourism dataset was split into two separate datasets, with a shared key provided for joining them.
1 Data overview
This is the glimpse of your data :
Rows: 50,314
Columns: 6
$ year      <dbl> 2014, 2014, 2014, 2014, 2014, 2014, 2014, 2014, 2014, 2014, …
$ quarter   <int> 4, 4, 4, 4, 4, 4, 4, 4, 4, 4, 4, 4, 4, 4, 4, 4, 4, 4, 4, 4, …
$ purpose   <chr> "Business", "Business", "Business", "Holiday", "Holiday", "B…
$ trips     <dbl> 3.2724, 1.7111, 104.5548, 96.3376, 37.1830, 11.2575, 67.2443…
$ region_id <int> 4, 6, 9, 9, 14, 16, 16, 20, 20, 23, 29, 29, 30, 30, 32, 33, …
$ ws_id     <chr> "946830-99999", "948650-99999", "946750-99999", "946750-9999…
2 Join regional metadata to quarterly counts
We keep only rows with a valid region name after the join.
Rows: 49,145
Columns: 9
$ year      <dbl> 2014, 2014, 2014, 2014, 2014, 2014, 2014, 2014, 2014, 2014, …
$ quarter   <int> 4, 4, 4, 4, 4, 4, 4, 4, 4, 4, 4, 4, 4, 4, 4, 4, 4, 4, 4, 4, …
$ purpose   <chr> "Business", "Business", "Business", "Holiday", "Holiday", "B…
$ trips     <dbl> 3.2724, 1.7111, 104.5548, 96.3376, 37.1830, 11.2575, 67.2443…
$ region_id <int> 4, 6, 9, 9, 14, 16, 16, 20, 20, 23, 29, 29, 30, 30, 32, 33, …
$ ws_id     <chr> "946830-99999", "948650-99999", "946750-99999", "946750-9999…
$ region    <chr> "Aberfoyle Park", "Acton", "Adelaide", "Adelaide", "Agnes Wa…
$ lon       <dbl> 138.6094, 144.8245, 138.6005, 138.6005, 151.7012, 148.9133, …
$ lat       <dbl> -35.07996, -37.86191, -34.92611, -34.92611, -24.38361, -20.1…
If you only need a subset of columns, select them first to keep memory small, for example: select(region_id, quarter, visitors, lon, lat).
3 Optional: add nearest weather station metadata
If your quarterly table contains a ws_id, you can join station attributes:
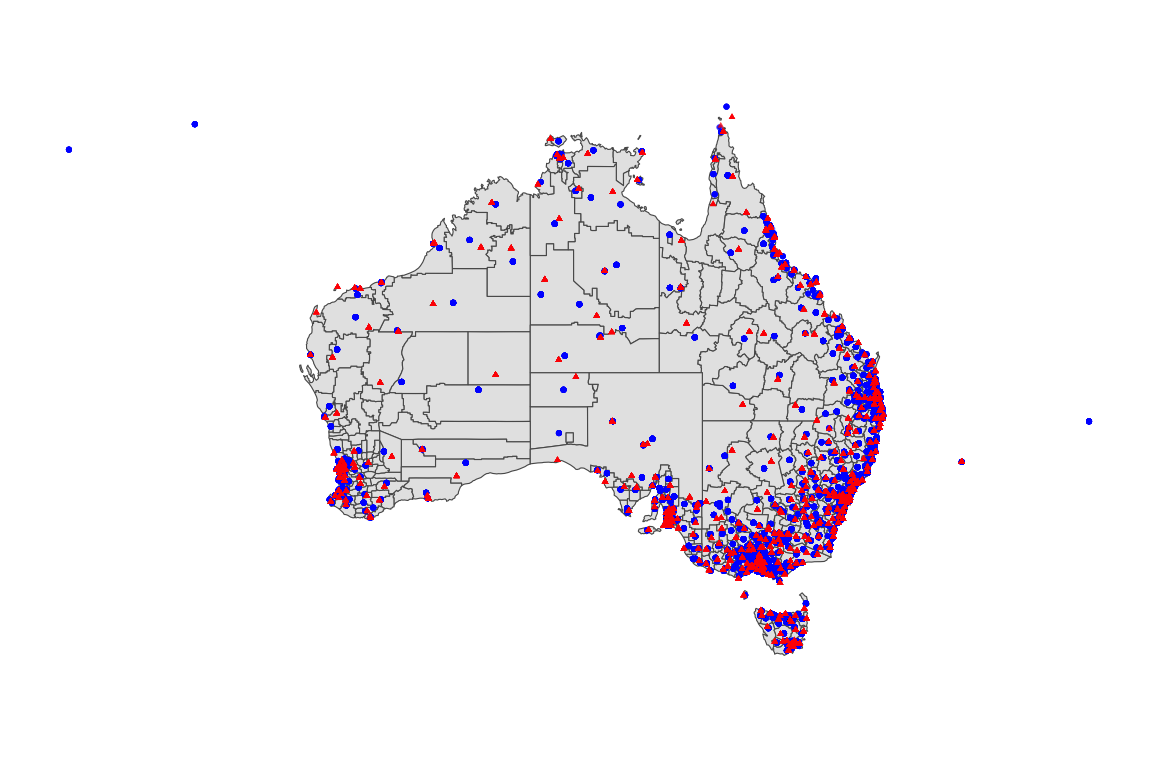
4 A quick map
We’ll plot tourism site coordinates and, when available, their weather stations.
If station coordinates stn_lon and stn_lat are present, overlay them too: