
👋 Welcome
The ecotourism package provides tools to analyze ecological observation data alongside weather conditions. This guide will help you get started with the package and direct you to detailed vignettes for specific organisms and workflows.
🧭 What You Can Do
Analyze observation records for various species with tools to:
- 📍 Identify top observation sites
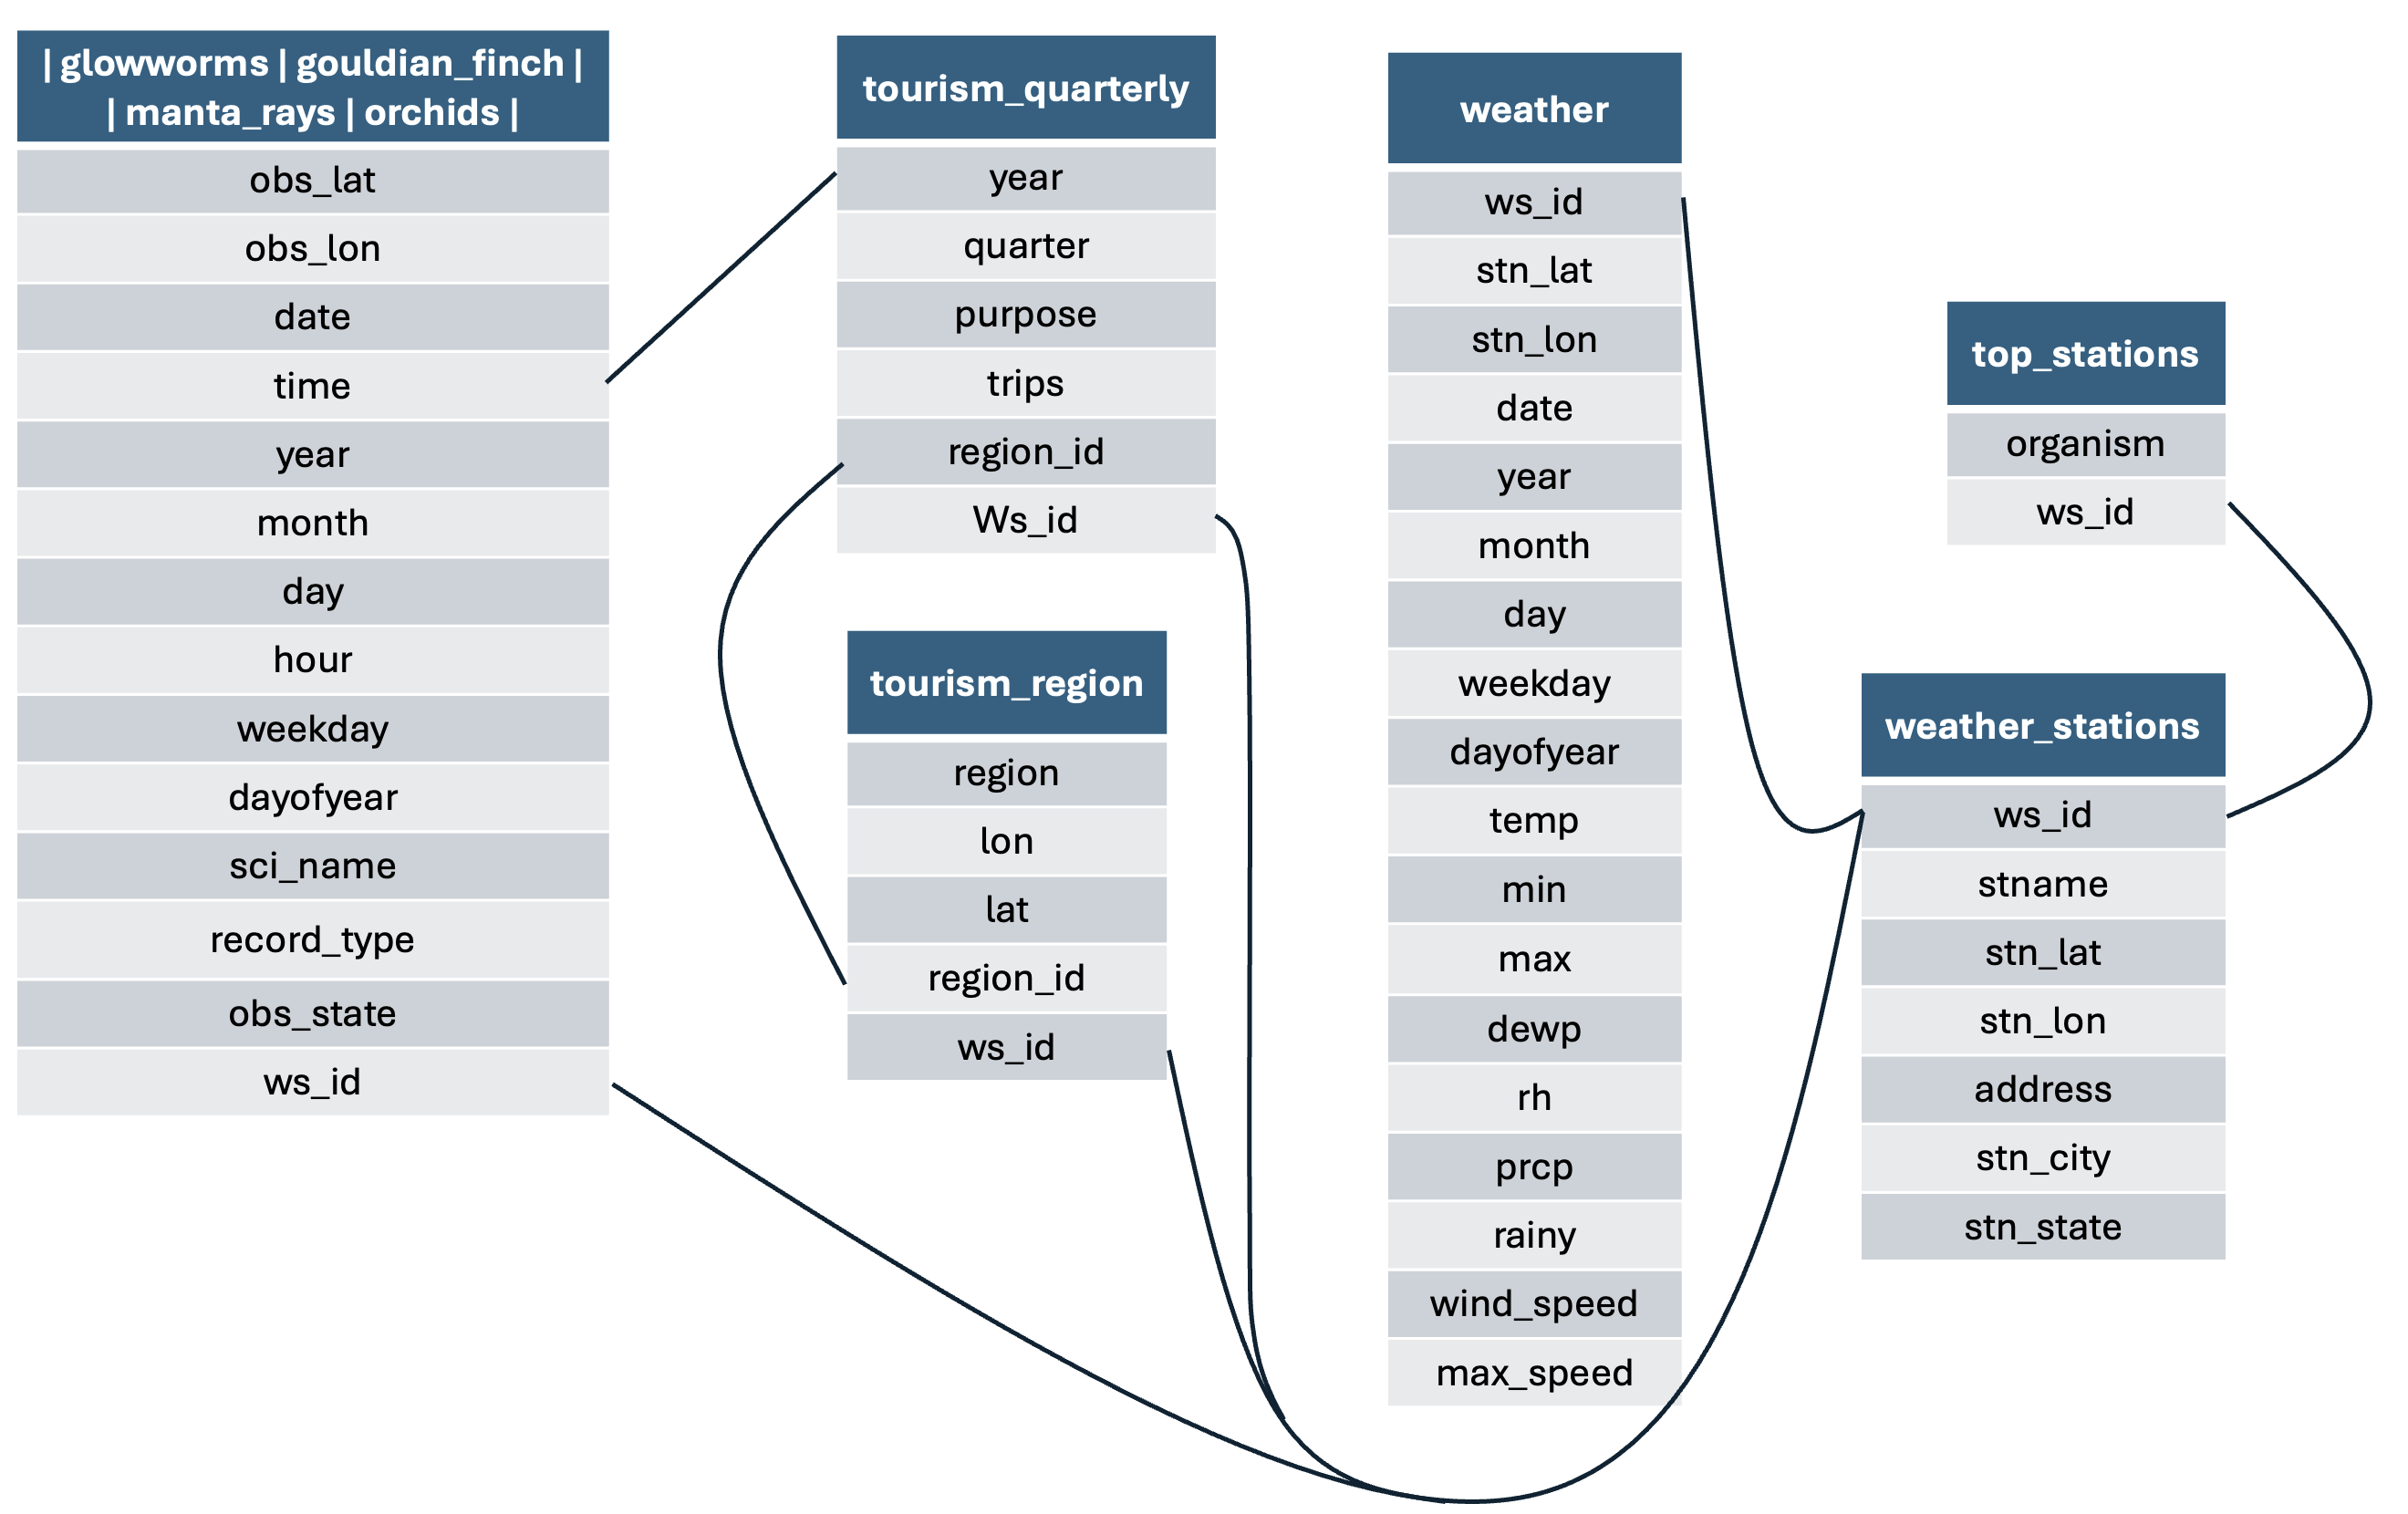
- 🌦️ Integrate environmental data from nearby weather stations
- 🗺️ Visualize spatiotemporal patterns
🧪 Organism-Specific Workflows
Explore vignettes dedicated to individual species:
- 🔦 Glowworms Observations
- 🐦 Gouldian Finch Observations
- 🐠 Manta Rays Observations
- 🌸 Orchids Observations
Each vignette covers data cleaning and wrangling, mapping and temporal summaries, and top station selection.
🌤️ Weather Integration
- 📊 Weather Data Workflow — Join species data with daily weather from nearby stations.
- 🗺️ Weather Station Metadata — View coordinates and metadata for weather stations used in analysis.
🎓 Teaching and Assessment Resources
Two companion resources help lecturers turn the package datasets into reproducible exercises and quizzes:
- ecosanctuary is an R package that validates, selects, and builds reusable Quarto or R Markdown questions. It produces Moodle XML, interactive student practice quizzes, teacher answer keys with worked solutions, printable PDFs, and a selection manifest.
- The GSoC 2026 ecotourism question bank contains 45 ready-to-use R questions based on
ecotourism: 15 easy, 15 medium, and 15 hard. Topics range from data exploration and visualisation to joins, functions, iteration, and multi-dataset analysis.
The question bank supplies the teaching content; ecosanctuary supplies the tools that validate, select, and render it. Use the entire bank or select questions by ID, topic, and difficulty to create reproducible teaching and assessment materials.